The Science of Land Surface Temperature
A reading guide to how satellites sense heat, how raw sensor signals become calibrated temperature maps, and why the resulting Urban Heat Island patterns matter for public health. Prepared for classroom use — each section below can be assigned as a standalone reading.
Electromagnetic Radiation (EMR) and Thermal Waves
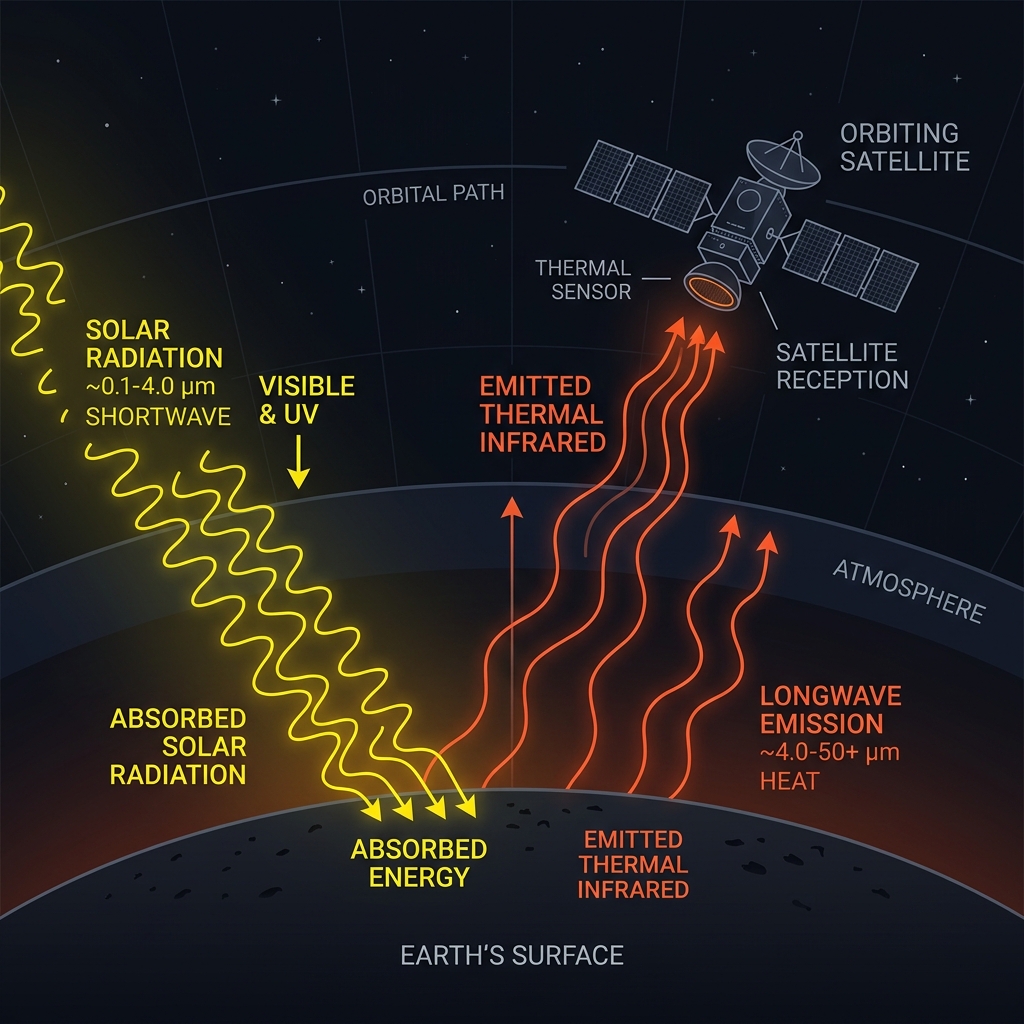
Unlike air temperature, which is measured by weather stations a few meters above the ground, Land Surface Temperature (LST) measures how hot the "skin" of the Earth actually feels — the radiant temperature of rooftops, pavement, soil, and canopy tops. This relies on understanding how Electromagnetic Radiation (EMR) interacts with matter.
During the day, high-energy shortwave solar radiation (roughly 0.1–4.0 µm, peaking in the visible and near-infrared) strikes the Earth. The surface absorbs a portion of this energy, warms up, and re-emits it back toward the atmosphere as lower-energy longwave thermal infrared radiation (roughly 4–50+ µm). Thermal sensors on satellites, like those on MODIS and Landsat, are built to detect specifically within the 10–12.5 µm atmospheric window — a narrow band of wavelengths where the atmosphere is relatively transparent to outgoing heat — to calculate the temperature of the surface below.
Satellites Used for LST
MODIS (Terra & Aqua)
- Sensor: Moderate Resolution Imaging Spectroradiometer
- Thermal Wavelengths: 10.78–12.27 µm (Bands 31 & 32)
- Spatial Resolution: 1 km (1000 meters)
- Temporal Resolution: Daily (1–2 times per day)
- Data Availability: Feb 2000 to Present
Landsat 8 & 9
- Sensor: Thermal Infrared Sensor (TIRS)
- Thermal Wavelengths: 10.60–12.51 µm (Bands 10 & 11)
- Spatial Resolution: 100 m (resampled to 30 m)
- Temporal Resolution: 16 days (8 days combined)
- Data Availability: April 2013 to Present
Advanced: From Radiance to Temperature
The Physics: Blackbody Radiation and Brightness Temperature
A satellite's thermal sensor does not measure temperature directly — it measures spectral radiance, the amount of energy arriving at the sensor within a specific wavelength band. Converting that radiance into a temperature starts with Planck's Law, which describes how much radiation a perfect emitter (a "blackbody") gives off at a given temperature:
where h is Planck's constant, c is the speed of light, k is Boltzmann's constant, λ is wavelength, and T is temperature in Kelvin. Because this relationship is well defined, it can be inverted: given a measured radiance, the equation solves backward for the temperature a perfect blackbody would need to have produced that radiance. This is called the at-sensor brightness temperature — the raw, uncorrected temperature value before any surface or atmospheric corrections are applied.
Emissivity: Why Materials Don't Radiate Like Blackbodies
Emissivity (ε) is the ratio of the radiation a real material emits compared to a theoretical blackbody at the same temperature, expressed on a scale from 0 to 1. By Kirchhoff's Law of thermal radiation, for an opaque surface in thermal equilibrium, emissivity equals absorptivity — a material that readily absorbs thermal-infrared energy will just as readily emit it. This is why emissivity varies so much by land cover:
- Dense vegetation: ε ≈ 0.98–0.99 (close to a blackbody)
- Bare, dry soil: ε ≈ 0.92–0.96
- Water: ε ≈ 0.98–0.99
- Concrete & asphalt: ε ≈ 0.90–0.96, but highly variable with roughness and age
- Bare metal roofing: ε can drop below 0.30, causing large errors if uncorrected
Because a pixel with lower emissivity radiates less energy at a given true temperature, failing to correct for emissivity is one of the largest sources of error in satellite-derived LST — often several degrees Celsius over urban surfaces with mixed construction materials.
Correcting for the Atmosphere: The Radiative Transfer Equation
Between the ground and the satellite sits roughly 700–800 km of atmosphere containing water vapor, aerosols, and gases that absorb and re-emit thermal radiation. The signal a sensor actually records is a mixture of three components, described by the atmospheric Radiative Transfer Equation (RTE):
Reading it left to right: the true surface emission (ε·B(LST)) is mixed with downwelling atmospheric radiance reflected off the surface ((1−ε)·L↓), the whole signal is then attenuated as it travels up through the atmosphere (multiplied by transmittance τ), and finally the atmosphere itself adds its own upwelling path radiance (L↑) directly into the sensor's field of view. Water vapor is the dominant culprit: humid conditions can suppress the signal enough to introduce several degrees of error if left uncorrected, which is precisely the problem the algorithms below are designed to solve.
Solving the Equation: Split-Window & Single-Channel Algorithms
Because the atmospheric terms (τ, L↑, L↓) are unknown at the moment of image capture, LST algorithms use clever mathematical shortcuts instead of solving the RTE directly for every pixel.
Split-window algorithms (used operationally for MODIS and available for Landsat) exploit the fact that water vapor absorbs thermal radiation slightly differently at two adjacent wavelengths — typically ~11 µm and ~12 µm. The difference between the brightness temperatures measured in these two bands is proportional to the amount of atmospheric water vapor present, which allows the atmospheric effect to be estimated from the image itself, without needing a full atmospheric profile:
+ (c3+c4W)(1−ε) + (c5+c6W)Δε
where Ti and Tj are the brightness temperatures in the two thermal bands, ε is the mean band emissivity, Δε is the emissivity difference between the bands, W is atmospheric water vapor content, and c0–c6 are coefficients derived from radiative transfer simulations (Sobrino et al.; Jiménez-Muñoz & Sobrino). This general form underlies the operational MODIS MOD11 land surface temperature product.
Landsat 8/9's second thermal band (Band 11) has known calibration uncertainty due to stray light, so many Landsat workflows instead use a single-channel algorithm (Jiménez-Muñoz & Sobrino), which corrects Band 10 alone using atmospheric water vapor content pulled from reanalysis data (e.g., NCEP) rather than a second thermal band.
The full processing chain, from raw satellite signal to a finished LST map, generally follows these steps:
- Sensor records raw digital numbers (DN) in each thermal band.
- DNs are converted to at-sensor spectral radiance using calibration coefficients.
- Radiance is inverted through Planck's Law to get at-sensor brightness temperature (assumes ε=1).
- Land surface emissivity is estimated independently (see below) for every pixel.
- A split-window or single-channel algorithm combines brightness temperature(s), emissivity, and (if needed) atmospheric water vapor to solve the RTE for true LST.
- The result is delivered as a gridded LST product, typically in Kelvin, and converted to °C or °F for interpretation.
Estimating Emissivity Across a Scene
Because emissivity itself is unknown ahead of time, algorithms need a way to estimate it for every pixel before they can solve for LST. Three approaches are widely used:
- NDVI threshold / vegetation-cover method: Uses the Normalized Difference Vegetation Index (NDVI) as a proxy for how much of a pixel is vegetated versus bare soil or impervious surface, then blends known emissivity values for "pure vegetation" and "pure soil" according to the fractional vegetation cover (Pv):
Fractional vegetation cover and blended emissivity Pv = [ (NDVI − NDVIsoil) / (NDVIveg − NDVIsoil) ]²where C is a small correction term for surface roughness ("cavity effect"). This is the method most commonly used in Google Earth Engine-based LST workflows.
ε = εveg·Pv + εsoil·(1−Pv) + C - Classification-based look-up tables: Assigns a fixed emissivity value to each pixel based on land-cover classification (e.g., using ASTER Global Emissivity Database spectral libraries for urban materials, water, and vegetation types).
- Temperature-Emissivity Separation (TES): A more advanced physics-based approach — used in the MODIS MOD21 product — that simultaneously solves for both temperature and per-band emissivity using multiple thermal bands, without assuming emissivity ahead of time. It generally outperforms split-window methods over spectrally complex urban surfaces.
From Algorithm to Product, and How We Know It's Right
NASA distributes two complementary MODIS LST products: MOD11 (generalized split-window algorithm, daily global coverage) and MOD21 (physics-based TES algorithm, higher accuracy but more computationally demanding). Landsat's Collection 2 Level-2 LST product uses the single-channel approach combined with ASTER-derived emissivity and NCEP atmospheric reanalysis profiles.
These products are validated against ground-based thermal radiometers at instrumented field sites and buoys (for water surfaces), which independently measure the true radiometric surface temperature for direct comparison. Under good conditions, validated LST products achieve accuracies within about 1–2 Kelvin of ground truth. Remaining sources of uncertainty that students and researchers should keep in mind include: cloud contamination (thermal sensors cannot see through clouds), viewing-angle effects over 3-D urban canyons, mixed pixels at coarser MODIS resolution, and emissivity errors over unusual or newly installed surface materials.
Urban Heat Island (UHI) Effect
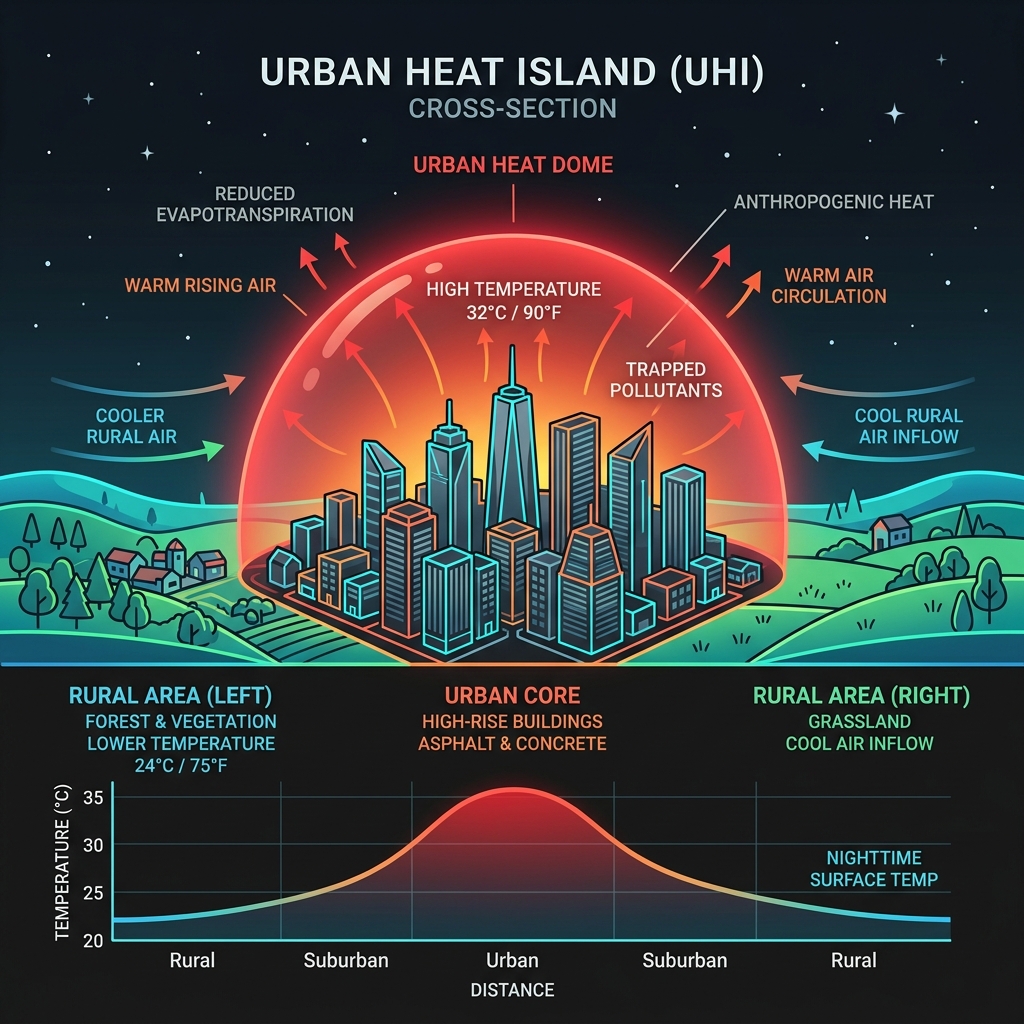
Urban areas experience significantly higher temperatures than surrounding rural areas due to human activities and the materials used in cities. Dark surfaces like asphalt and concrete roofs absorb vastly more solar radiation than natural landscapes.
Furthermore, cities suffer from a lack of vegetation, which means less cooling from evapotranspiration (the process where plants release water vapor). Waste heat from vehicles, air conditioners, and industry (anthropogenic heat flux) adds further warming, and the tall, dense geometry of buildings traps outgoing longwave radiation at night, slowing how quickly cities cool down after sunset. Together these effects create a persistent "heat dome" over the urban core, most pronounced after dark when rural areas have already released their stored heat.
- Draw a polygon over a city center and compare it to a nearby forest or rural area. You'll often see temperature differences of 5–10°C (9–18°F) on a hot summer day!
Urban Heat and Human Health: What Recent Research Shows
Land surface temperature mapping isn't just an academic exercise — it is one of the primary tools researchers use to identify where extreme heat exposure and heat-related mortality risk concentrate within cities. The readings below, drawn from peer-reviewed journals and science journalism published largely in 2023–2026, show that the urban heat – health relationship plays out differently across regions, income levels, and adaptation capacity.
Cooling cities down: urban heat islands and excess summer mortality
Iungman et al., reported via ScienceDaily (2023)An analysis across 93 European cities found that more than 4% of all summer deaths were attributable to the urban heat island effect specifically — separate from background heat-related mortality — and that increasing urban tree cover could meaningfully reduce that toll.
Read summary →Economic valuation of temperature-related mortality attributed to urban heat islands in European cities
Nature Communications (2023)Quantifies the economic cost of UHI-attributable deaths across European cities, translating excess mortality into monetary terms to help city planners prioritize cooling investments such as green infrastructure and reflective surfaces.
Read paper →Disproportionate exposure to urban heat island intensity across major US cities
Hsu et al., Nature Communications (2021)A widely cited analysis of over 100 US cities showing that people of color and lower-income residents are systematically exposed to more intense urban heat — a pattern traced in many cities to historical redlining and unequal tree-canopy investment.
Read paper →Urban heat islands and heat-related mortality across 70 paired urban-rural counties in 8 topographic regions
ScienceDirect (2025)Compares matched urban and rural counties across China's diverse terrain to isolate how much of China's heat-mortality burden is specifically attributable to the urban heat island effect versus broader climate warming.
Read paper →Urban heat islands increase or reduce mortality in different cities
Nature Climate Change (2025)A cross-city comparative study finding that the UHI effect on mortality is not uniform worldwide — in some cities UHI intensifies heat mortality, while in a smaller number of cooler or higher-latitude cities it can slightly reduce cold-related mortality, complicating one-size-fits-all policy responses.
Read paper →Dual impact of global urban overheating on mortality
Nature Climate Change (2025)Models the combined effect of urban warming on both heat-season and cold-season mortality worldwide, providing one of the most comprehensive global estimates of net health impact from city-level overheating to date.
Read paper →Greening mitigates heat-related mortality in Paris
npj Urban Sustainability (2025)A city-scale case study modeling how expanded urban greening scenarios in Paris would reduce heat-attributable deaths, offering a concrete, policy-relevant example of the mitigation pathways discussed more broadly in the other readings.
Read paper →Urban heat islands have solutions; many tropical cities can't afford them
Mongabay News (2026)A magazine-style feature reporting on the equity gap in heat adaptation: while cooling strategies like reflective roofing and urban greening are well documented, many rapidly urbanizing tropical cities lack the municipal budget to implement them at scale — a useful discussion piece for classes on climate justice.
Read article →Urban heat islands and heat mortality
ECMWF Stories (feature)An accessible, well-illustrated explainer from the European Centre for Medium-Range Weather Forecasts connecting urban climate modeling to real-world heat mortality risk — a good entry point for students before tackling the primary literature above.
Read feature →Global dataset on heat wave exposure due to the urban heat island effect
Scientific Data (2026)Publishes an open, city-by-city global dataset isolating how much extra heatwave exposure each city's population experiences specifically because of the UHI effect — a valuable resource for student research projects and comparative analysis.
Read paper →A full bibliography of these sources, formatted for citation, is available on the Additional Reading tab.
Additional Reading
Supporting materials for instructors and students using this tool as a course reading: a glossary of key terms, external data and training portals, a formatted bibliography for the literature cited in the LST Theory tab, and discussion questions suitable for lecture or lab sections.
📖 Key Vocabulary
- Land Surface Temperature (LST)
- The radiative "skin" temperature of the ground, roofs, or canopy top — distinct from the air temperature reported in a weather forecast.
- Brightness Temperature
- The temperature calculated directly from sensor radiance assuming the surface is a perfect blackbody (ε=1); always an underestimate of true LST.
- Emissivity (ε)
- A 0–1 ratio describing how efficiently a material radiates thermal energy compared to a perfect blackbody at the same temperature.
- Blackbody
- A theoretical object that absorbs and re-emits all incoming radiation perfectly; used as the physical reference point in Planck's Law.
- Radiative Transfer Equation (RTE)
- The physical equation describing how surface radiance is modified by atmospheric absorption, emission, and transmittance before reaching a satellite sensor.
- Split-Window Algorithm
- A method for retrieving LST using two adjacent thermal infrared bands, exploiting their differential sensitivity to atmospheric water vapor.
- NDVI
- Normalized Difference Vegetation Index; a measure of vegetation greenness derived from red and near-infrared reflectance, often used as a proxy input for estimating emissivity.
- Urban Heat Island (UHI)
- The measurable tendency of urban areas to be warmer than surrounding rural areas due to surface materials, reduced vegetation, and anthropogenic heat.
- Evapotranspiration
- The combined process of evaporation from soil/water surfaces and transpiration from plants, which cools the surrounding air and surface.
- Atmospheric Window
- A wavelength range (~10–12.5 µm for thermal sensing) where the atmosphere is relatively transparent, allowing surface-emitted radiation to reach a satellite with minimal absorption.
External Data & Learning Resources
-
NASA MOD11 Land Surface Temperature Product Page Official product documentation for the MODIS split-window LST algorithm.
-
MOD11 Algorithm Theoretical Basis Document The full technical derivation of the split-window equation used operationally by NASA.
-
MOD21 (TES Algorithm) Theoretical Basis Document Documentation for the physics-based Temperature-Emissivity Separation product.
-
USGS EarthExplorer Download free Landsat 8/9 imagery, including Collection 2 Level-2 LST products.
-
Google Earth Engine The cloud-computing platform that powers the Interactive Map tab of this tool — free for academic and research use.
-
EPA Heat Island Effect Program Policy-oriented resources on measuring and mitigating urban heat islands in US cities.
-
NASA ARSET Training Program Free short courses on applying satellite remote sensing data, including thermal/LST applications, for students and professionals.
-
Furman University Spatial Analysis Lab Home lab for this teaching tool — explore related class projects and research.
Further Reading: Full Bibliography
Formatted for citation. Access dates reflect when these sources were last verified for this reading guide (August 2026).
- Iungman, T., et al. (2023). Cooling cities down: the impact of the urban heat island effect on excess mortality in European cities. Summarized in ScienceDaily. sciencedaily.com/releases/2023/01/230131193752.htm
- Authors various. (2023). Economic valuation of temperature-related mortality attributed to urban heat islands in European cities. Nature Communications. nature.com/articles/s41467-023-43135-z
- Hsu, A., et al. (2021). Disproportionate exposure to urban heat island intensity across major US cities. Nature Communications, 12, 2721. nature.com/articles/s41467-021-22799-5
- Authors various. (2025). Association between urban heat islands and heat-related mortality in 70 pairs of adjacent urban-rural counties among 8 topographic regions in China. ScienceDirect (Urban Climate / related journal). sciencedirect.com/science/article/abs/pii/S2210670725000605
- Authors various. (2025). Urban heat islands increase or reduce mortality in different cities. Nature Climate Change. nature.com/articles/s41558-025-02310-4
- Authors various. (2025). Dual impact of global urban overheating on mortality. Nature Climate Change. nature.com/articles/s41558-025-02303-3
- Authors various. (2025). Greening mitigates heat-related mortality in Paris. npj Urban Sustainability. nature.com/articles/s42949-025-00334-5
- Mongabay News. (2026, August). Urban heat islands have solutions; many tropical cities can't afford them. news.mongabay.com/2026/08/urban-heat-islands-have-solutions
- European Centre for Medium-Range Weather Forecasts (ECMWF). Urban heat islands and heat mortality [Feature]. stories.ecmwf.int/urban-heat-islands-and-heat-mortality
- Authors various. (2026). Global dataset on heat wave exposure due to the urban heat island effect. Scientific Data. nature.com/articles/s41597-026-06877-1
- NASA LP DAAC. MOD11 Land Surface Temperature/Emissivity Algorithm Theoretical Basis Document. modis.gsfc.nasa.gov/data/atbd/atbd_mod11.pdf
- Hulley, G. (NASA JPL). MOD21 Land Surface Temperature/Emissivity Algorithm Theoretical Basis Document, v2.4. modis-land.gsfc.nasa.gov/pdf/MOD21_ATBD_Hulley_v2.4.pdf
Discussion Questions for the Classroom
- Why does a satellite need to correct for both atmospheric water vapor and surface emissivity before it can report a trustworthy land surface temperature? What would happen to a city's mapped LST if only one of these corrections were applied?
- Explain, in your own words, why bare metal roofing (low emissivity) can appear artificially "cool" on a raw brightness-temperature map even if it is physically very hot to the touch.
- MODIS offers both the split-window MOD11 product and the physics-based MOD21 (TES) product. What trade-offs might lead a researcher to choose one over the other for a study of a single, spectrally complex city block versus a study of seasonal trends across an entire country?
- Compare the findings on urban heat and mortality from a wealthy European city study with the Mongabay feature on tropical Global South cities. What structural, economic, or policy factors might explain why the same physical phenomenon (UHI) produces different health outcomes in different regions?
- The Nature Climate Change (2025) study found that UHI reduces mortality in some cooler cities by lowering cold-season deaths. How should city planners weigh this against the clear evidence of increased heat-season mortality in warmer cities?
- Using the Interactive Map tab, draw a polygon over a city center and a nearby park or rural area. How large is the LST difference you observe, and how does that compare to the 5–10°C range cited in the UHI section above?